Middle School Science
One of the units that I created for middle school science focused on the explosive subject of earthquakes.
The students' interest in the subject was peaked due to the recent happenings of earthquakes around the globe, so it was an easy-to-make connection to their own personal lives.
The students' interest in the subject was peaked due to the recent happenings of earthquakes around the globe, so it was an easy-to-make connection to their own personal lives.
Main Objectives:
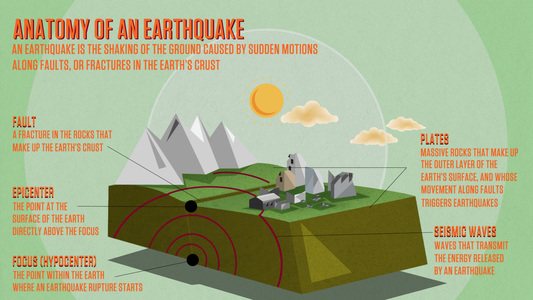
1. List and define 3 types of plate movements, stress, and faults.
2. Compare and Contrast 3 types of earthquake scales and apply their relevance.
3. Read and understand the waves illustrated on a seismograph.
Students began the lesson by discussing what they know about earthquakes and any personal experiences they had regarding earthquakes. I then gave them time to close their eyes and mull over what causes earthquakes. After about a minute I wrote student answers on the board in an open-forum classroom discussion.
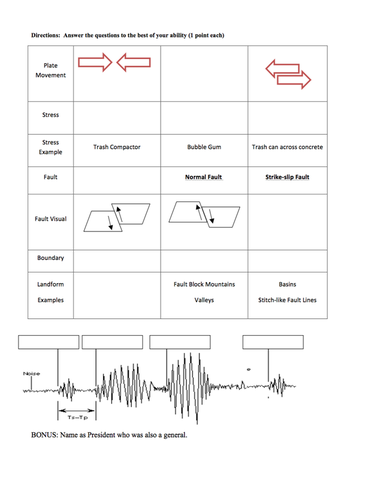
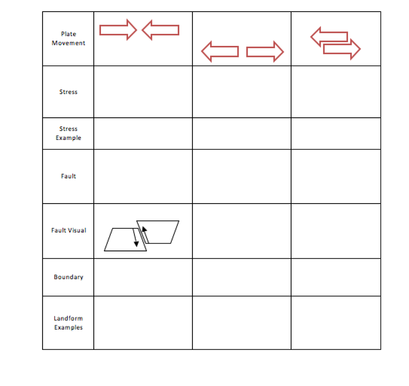
Students then read about earthquakes and faults in groups. We discussed the content and I then handed out a blank copy of the graphic organizer. Students were given directions to complete the graphic organizer in pairs. The blank graphic organizer featured to the left is what the students were tasked with completing.
|
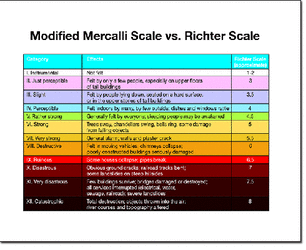
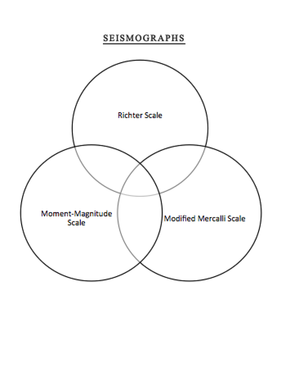
The next lesson of the unit focused on scales used to measure earthquakes. The Richter Scale, Modified Mercalli Scale and the Moment-Magnitude Scale are used to measure earthquakes and they all have similarities and different uses. Students learned about each and used a venn diagram to compare and contrast the 3 scales. The worksheet they used is featured to the right.
|
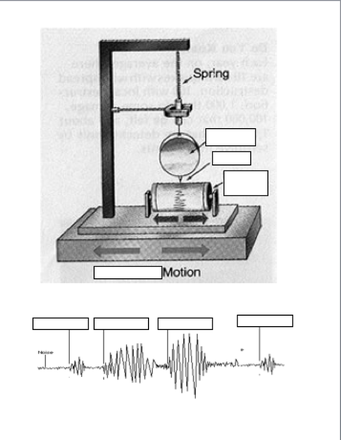
The 3rd lesson involves understanding what a seismograph is and how it works. To demonstrate this I had students hold a pencil on a piece of paper. The student was ordered not to move the pencil. Another student began move the desk forward while a third student shook the desk. The pencil markings gave a basic idea of how a seismogram operates. Students then learned the parts of a seismogram using picture visuals. The focus then shifted on reading the seismograph produced. The students learned that the size of the waves indicated strength and proximity of the earthquake. Students also learned about the 3 types of seismic waves and which travel the fastest/slowest. Students then learned about how scientists used seismographs and how they calculate the epicenter of an earthquake. Featured below is a simple worksheet that allowed student to label parts of the seismograph and read a basic seismogram.
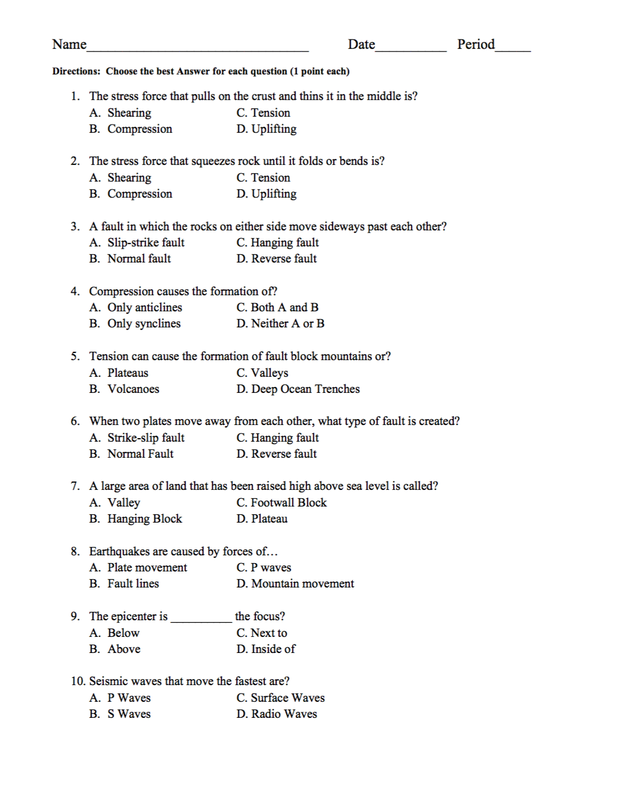
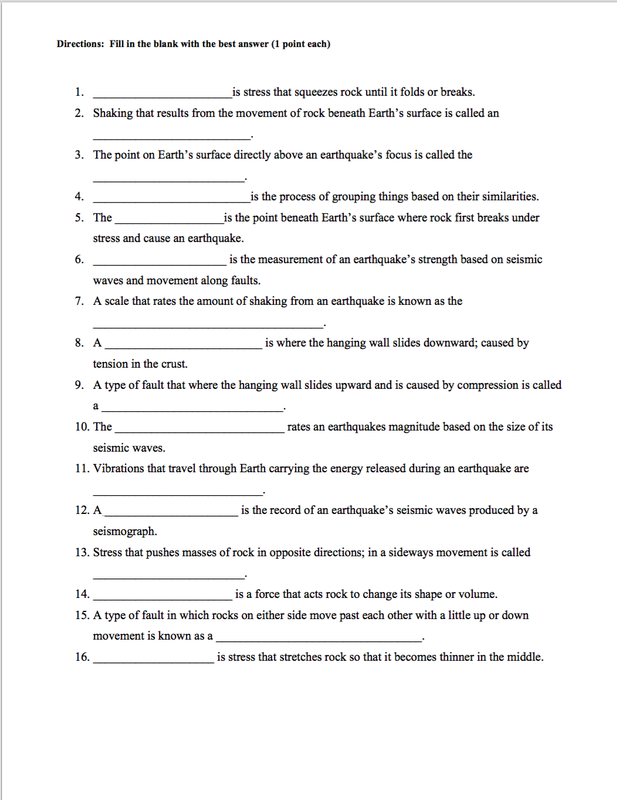
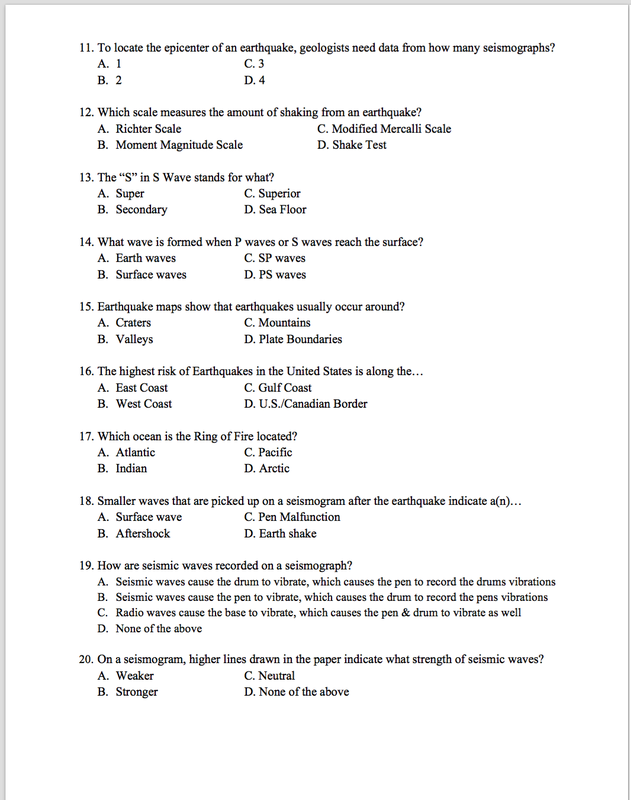
At the end of the unit I had students study from the worksheets provided and I created an exam to assess their knowledge. As the culminating assessment of the unit, I administered a unit exam, featured below. It contained all of the content taught, including the exact layout of the graphic organizer.
